I'm interested in knowing, which Formula 1 season had the most number of DNF's (Did Not Finish)?
-
Define "crash" and do you mean the number of cars involved or incidents?– davidjwestCommented Jul 28, 2017 at 10:44
-
@davidjwest Sir anything that make driver dnf because of involvement and incident just not mechanical failure getting into pit. And sir if you get the idea do edit the question.– Ram Chandra GiriCommented Jul 28, 2017 at 12:47
-
1I'll do some proper research later but I would expect this to be a season when there were more cars entering, probably in the 1950s– davidjwestCommented Jul 28, 2017 at 14:07
-
Not an answer yet as still looking but the 1998 Belgian GP had 12 retirements due to accidents out of 20 starters en.wikipedia.org/wiki/1998_Belgian_Grand_Prix– davidjwestCommented Aug 1, 2017 at 10:26
-
@davidjwest Sir what about 1996 monaco grand prix, and for 1998 belgian gp just because of that one race will it be a season with highest crashes.– Ram Chandra GiriCommented Aug 1, 2017 at 14:27
1 Answer
There are various reasons for a driver being classified as a DNF at a GP, including the following:
- Mechanical DNF
- Accidents
- NC (Not Classified)
- DSQ (Disqualified)
- DNQ (Did Not Qualify)
- WD (Withdrawn)
- DNS (Did Not Start)
I have therefore gathered data from the 1992 season to the 2016 season from various sources to answer your question and also to show everyone some interesting stats about the evolution of F1 since the 1990s.
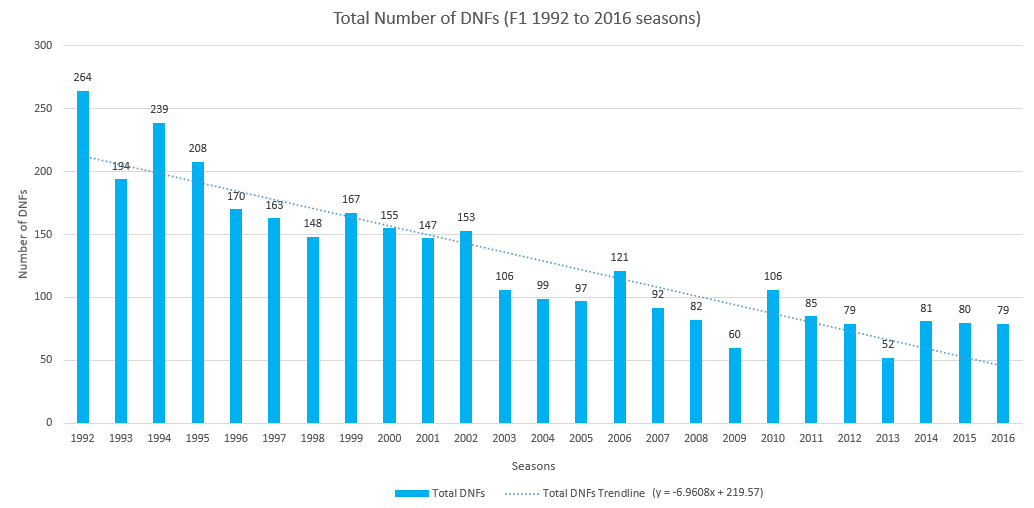
Let's start by answering your question. Based on the following chart, the season with the most DNF's (between 1992-2016) seems to be the 1992 season with 264 total DNF's, followed closely by the 1994 season with 239 total DNF's:
You really realise with the trendline y = -6.96x + 219 on the chart just by how much the number of accidents and mechanical failures decreased over the years, especially in 1996 and in 2003. I guess this shows how the cars evolved over the years and became much more reliable.
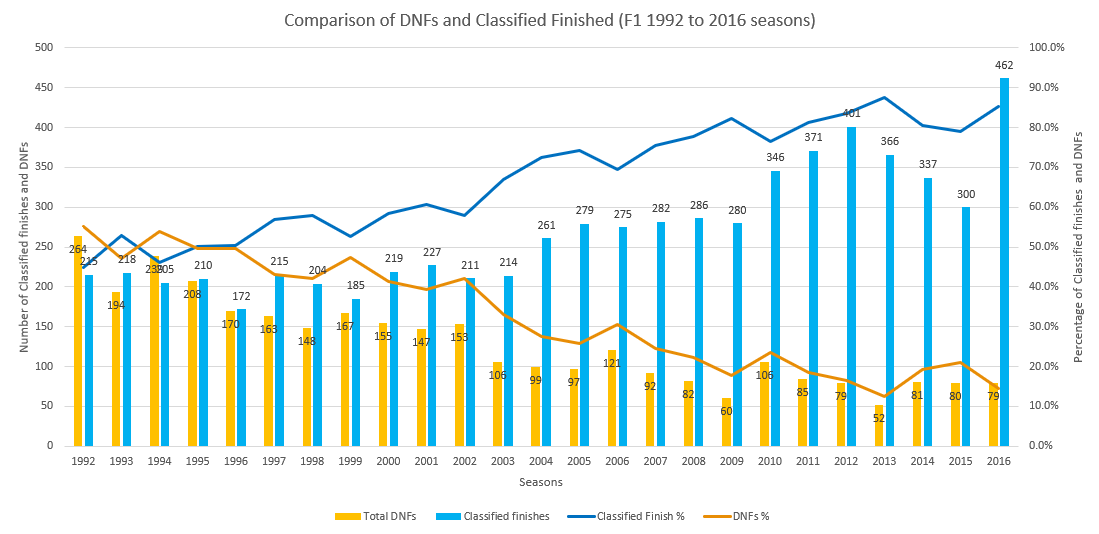
Now for the more interesting bit, here is a comparison chart showing the:
- Total number of DNF's
- Total number of classified finished
- Percentage of DNF's (based on all total possible finishes)
- Percentage of classified finishes (based on all total possible finishes)
I find it quite interesting to see the percentage of drivers who actually finished the races in the 1990s compare to the 2010s.
Looking at the columns, you can see the increasing gap between the orange column (total DNFs) and the blue column (total classified finishes). In the 1990s there were seasons (1992 & 1994) where the were more DNFs than classified finishes! Also looking at the blue and orange lines you can again see just how much they diverge after 2002.
Comparing the season with the most DNF's (1992 - 264 DNF's) and the one with the least (2013 - 52 DNF's), 87.6% of the drivers who participated at a GP were classified finishers in 2013, whereas in the 1992 season only 44.9% of the drivers actually finished the race!
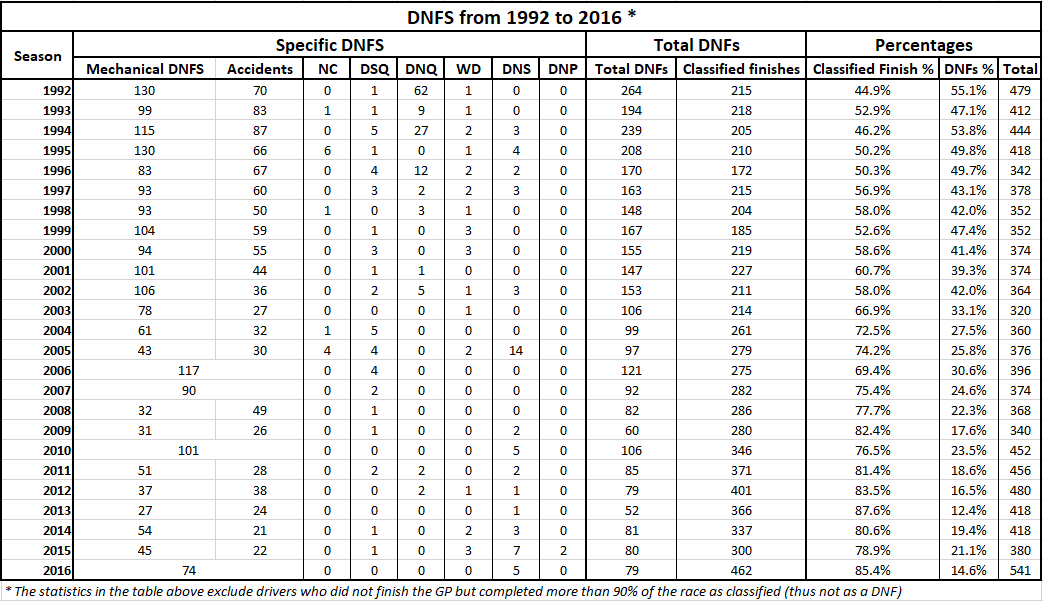
Finally, here is the table where I gathered all the data for you to see the details:
If anyone finds any mistakes in my data, please let me know so that I can make the changes. If you want access to the Excel spreadsheets I used to gather my data, send me a message so I can email it to you.
Sources:


